Olof Broström
Unverified Air
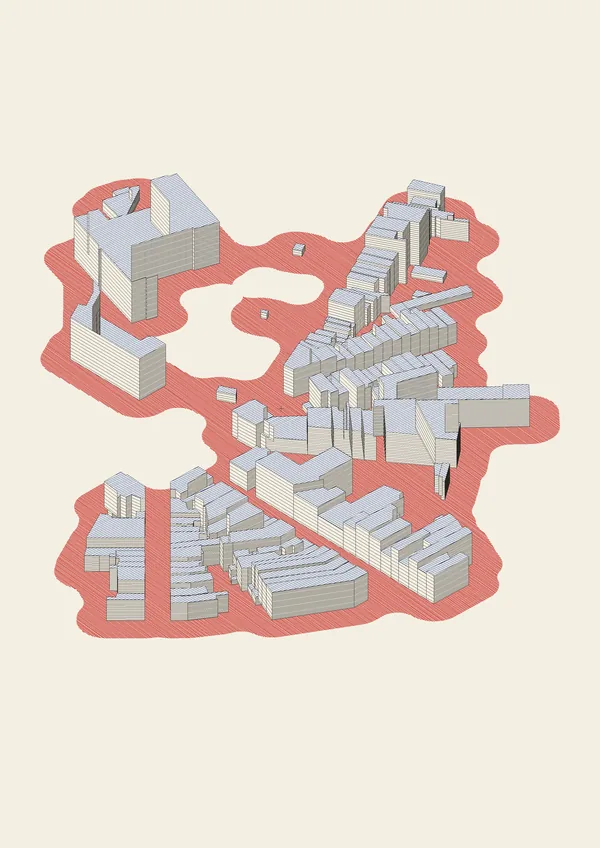
Drawings of the buildings around European air quality stations, with a day’s highest nitrogen dioxide in red and highest ozone in blue.
About the work
A map is never the place it shows. It is a set of choices about what to measure, what to leave out and how to draw what remains, and the same street can be described by the height of its buildings, the gases in its air, the hour or a pair of coordinates, each description accurate and none of them the street itself. Systems like these are attempts to make the world hold together, and they never quite reach it. What they offer instead is an estimate that enough of us can agree on.
Unverified Air is built from three such descriptions of the same places: an open map of buildings and the measurements of two gases in the air, nitrogen dioxide and ozone. Across Europe, thousands of stations sample the air every hour. Nitrogen dioxide comes mostly from car engines and other burning; it irritates the lungs and is highest near busy streets during the morning and evening rush. Ozone, by contrast, is not released by anything but forms on its own when sunlight falls on polluted air, which is why it rises in the afternoon. High in the atmosphere it shields us from the sun, while at street level it harms the lungs. The two are bound together, since the same traffic that releases nitrogen dioxide helps ozone to form and, close to the street, also breaks it down again. Neither can be seen.
Each day the program draws a country at random and then a station there that measures both gases. From the previous day’s records it takes the highest hour of each and lays them over the buildings around the station, drawn at their recorded heights as if seen from above at an angle: nitrogen dioxide as red lines over the open ground between the houses, ozone as blue lines over the roofs, the lines growing closer as the values rise.
What looks like a single moment is in fact assembled from many. The two values come from different hours of the day, and the buildings from registers compiled in different years by different people. Only places where most buildings have been measured can be drawn, so the work goes only where someone has already measured. The air itself is the least certain part: the European Environment Agency publishes its readings within hours, before anyone has checked them, and calls them unverified. Some will later be corrected or withdrawn, but the drawings keep them as they were on the day, a picture of something that never existed all at once.
Each work takes its title from the name the measuring station has been given in the official register, written exactly as it appears there. The series runs for one year, one drawing a day. Every drawing is shown here as an image and stored as a file for a pen plotter, in black, red and blue ink; sheets that are plotted are made in two copies, one for sale and one artist’s proof, and signed by hand.
Air quality: European Environment Agency (EEA), unverified up-to-date data, CC BY 4.0. Buildings: EUBUCCO and © OpenStreetMap contributors, ODbL. Places: Nominatim. Wind: Open-Meteo.