Weighted Voronoi stippling (Secord, 2002)
JAEV Notes · October 2026 · 2 min read
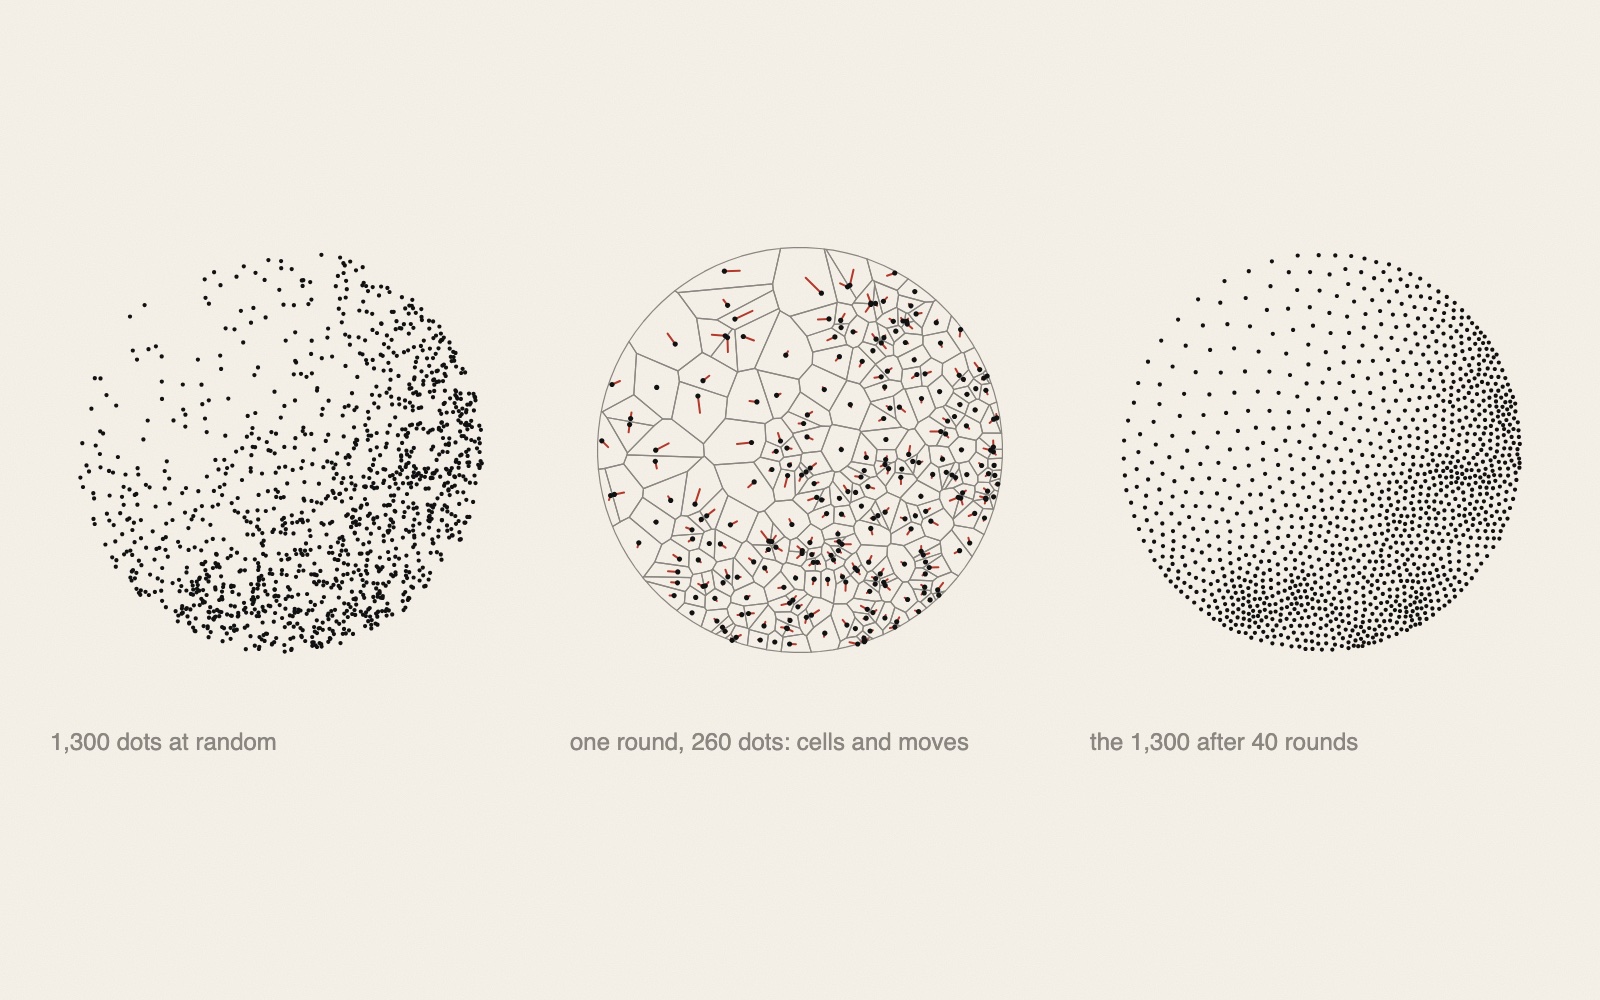
Weighted Voronoi stippling is a method for turning a grey image into a drawing of dots, evenly spaced but packed closer where the image is dark. It was published by Adrian Secord in 2002 at NPAR, the ACM's symposium on non-photorealistic animation and rendering; his paper describes "techniques for generating stipple drawings from grayscale images using weighted centroidal Voronoi diagrams".1
Stippling
Stippling is the old illustrator's technique that Secord set out to imitate: it "places small dots of ink onto paper such that their density give the impression of tone".1 Spacing is what makes it work. Dots scattered at random give, in Craig S. Kaplan and Robert Bosch's word, "unappealing" stipple drawings, because nothing controls how close a dot comes to its neighbours.2
How it works
The method builds on Lloyd's algorithm, which Stuart P. Lloyd of Bell Labs proposed in 1957 and published only in 1982.3
- Scatter. Put the chosen number of dots on the image, for example at random, with more of them where it is dark.
- Cells. Give every point of the image to whichever dot lies nearest, so that the image is divided into one region per dot, its Voronoi cell (see Voronoi diagrams).3
- Move. Move each dot to the centre of its cell, then repeat from step 2.3
Lloyd's algorithm, in its plain form, takes the ordinary centre of the cell's area, and the dots end up evenly spaced all over. Secord's change is to weight that centre by the image, with every pixel counting as much as it is dark; the centre of a cell is then pulled towards its darker part, the "centre of mass" if the image's tone gives the paper its weight.1, 2 Round after round, dots drift into the dark areas. Since each dot also keeps its distance from its neighbours, they stay evenly spread.
Secord computed the cells on graphics hardware, drawing a cone under each dot: seen from straight above, the cones form a Voronoi diagram.1 He stopped when the cells' sizes no longer changed much; the replication by Nicolas Rougier in 2017 simply ran 50 rounds.1
For plotters
Each dot is a short touch of the pen, so a stipple drawing is a natural plotter drawing. Evil Mad Scientist Laboratories' free program StippleGen (2012), written in Processing, makes stipple drawings "using Secord's algorithm" and saves them for their drawing machines.4 Its other option, one continuous line through all the dots, is TSP art: Kaplan and Bosch used Secord's own implementation to place the dots for theirs, and found the drawings tidier than with dots placed at random.2 For dots on a fixed pixel grid instead, see Floyd–Steinberg dithering.
Sources
- Nicolas P. Rougier, “[Re] Weighted Voronoi Stippling”. ReScience 3(1), 2017. Article and code on GitHub
Replicates Adrian Secord, “Weighted Voronoi Stippling”, NPAR ’02, ACM, 2002, pp. 37–43; quotes Secord: “techniques for generating stipple drawings from grayscale images using weighted centroidal Voronoi diagrams”, “the traditional artistic technique of stippling that places small dots of ink onto paper such that their density give the impression of tone”; weighted centroid formula; Secord's code archive “nowhere to be found”; cones seen from above give a Voronoi diagram (GPU); 50 iterations instead of Secord's stopping rule. - Craig S. Kaplan and Robert Bosch, “TSP Art”. Bridges: Renaissance Banff, 2005, pp. 301–308
Artists have used stippling “for well over a century”; Secord's method “is fast and automatic, and produces high-quality stippled drawings”; “moves each point to the centre of mass of its Voronoi region”; relaxation “will tend to space points out as evenly as possible while still approximating image tone”; thanks to Secord for his implementation. - “Lloyd's algorithm”. Wikipedia
“first proposed by Stuart P. Lloyd of Bell Labs in 1957”, “remained unpublished until 1982”; steps: Voronoi diagram, centroid of each cell, move each site; used to “generate dot drawings in the style of stippling”; Secord (2002) weights the centroids by an image. - Windell Oskay, “StippleGen: Weighted Voronoi stippling and TSP paths in Processing”. Evil Mad Scientist Laboratories, 12 April 2012
“generate stipple diagrams from images, using Secord’s algorithm”; “Adrian Secord’s own stippling software is no longer available for download”; written in Processing; “Eggbot-ready Inkscape SVG files”.
- Published
- JAEV Notes, October 2026.
- Use
- Text CC BY 4.0. Free to use and quote with credit to JAEV and a link to this page. Images and quotations by others keep their own terms.
All texts as one file: archive.json - Cite
- JAEV Notes, “Weighted Voronoi stippling (Secord, 2002)”, jaev.gallery/notes/weighted-voronoi-stippling/, 2026.
- Corrections
- Additions and corrections are welcome: info@jaev.gallery
- Share
A link from your own site, course page or reading list helps others find it.- Follow
- New notes by RSS · Instagram · Bluesky
JAEV is a daemon taking shape: machines, weights, room, brain.