Manfred Mohr
The cube as an alphabet
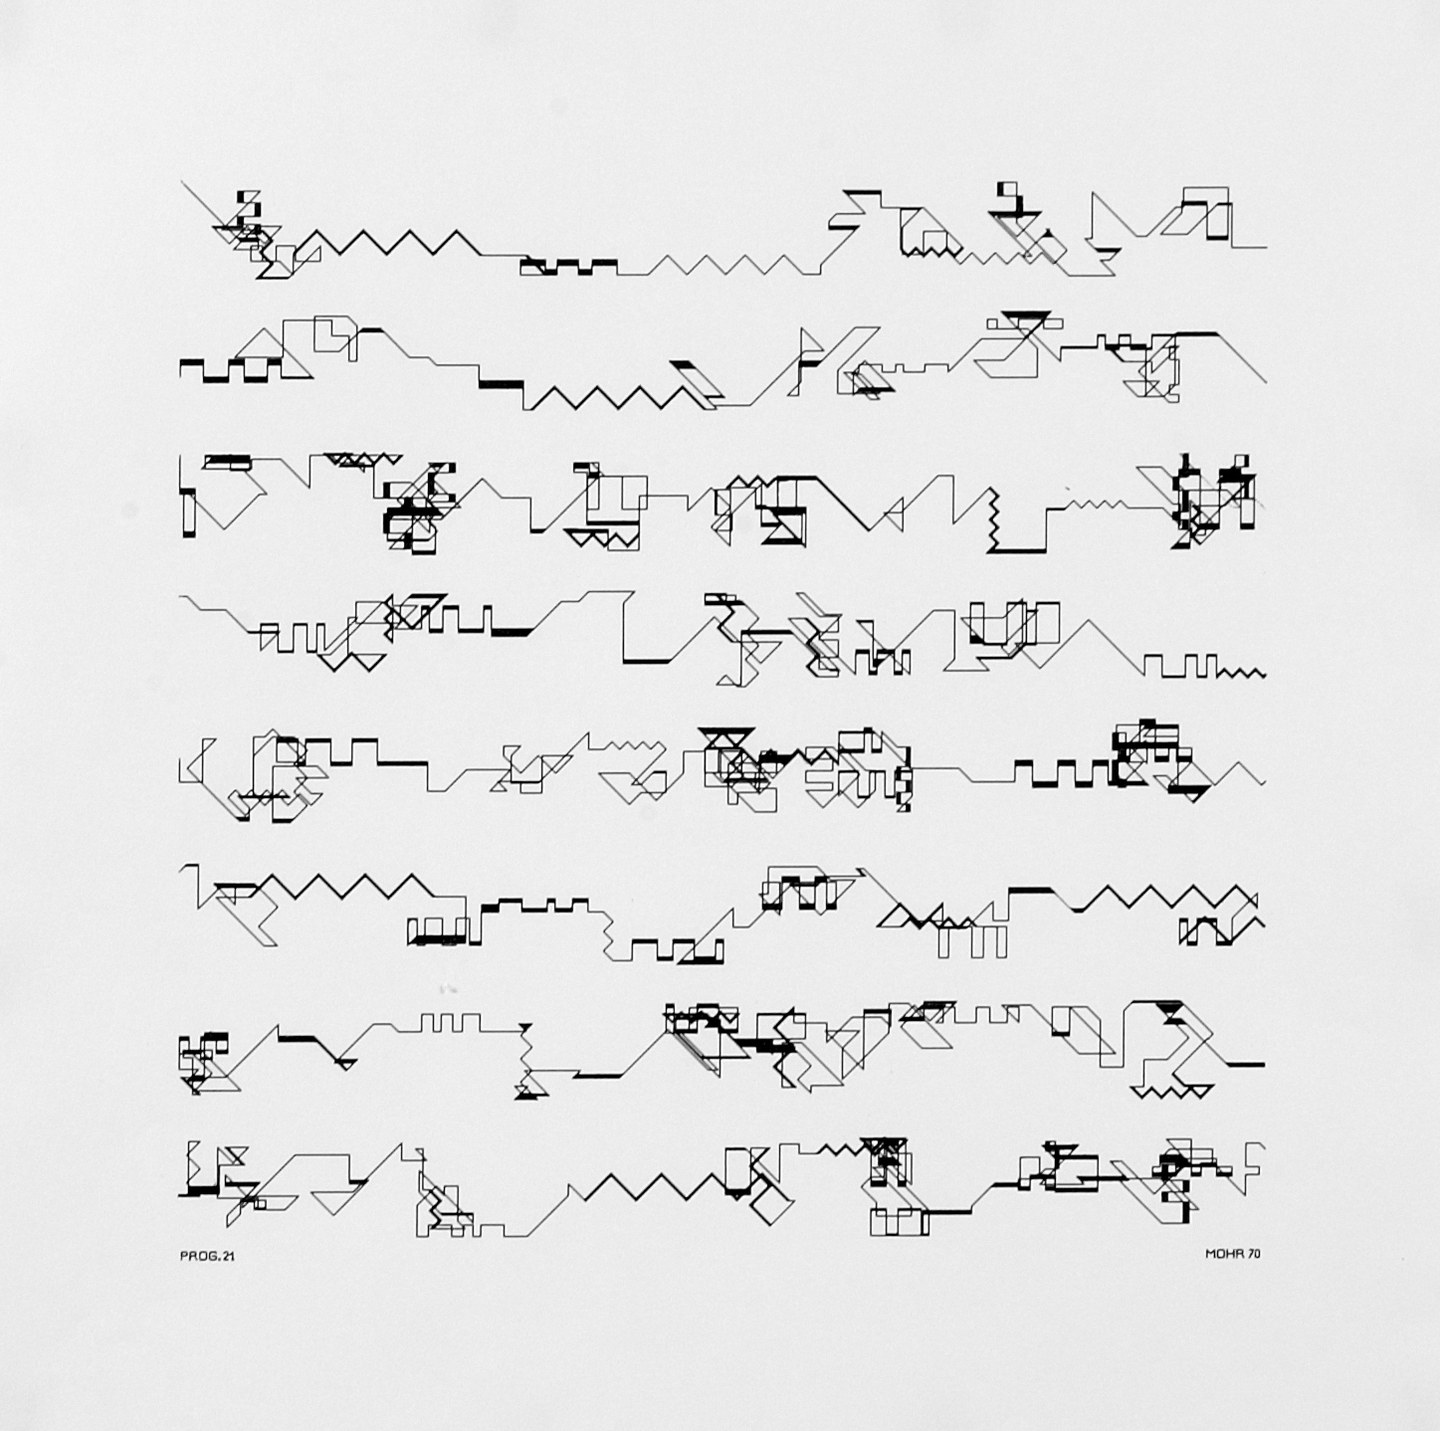
In 1973 Manfred Mohr stopped looking for new forms and settled on one: the cube. "The 12 edges of the cube became my alphabet to which I apply algorithms," he writes.1 It stayed at the centre of his work for more than forty years, together with its four-dimensional relative, the hypercube. This text is about what he does with those twelve lines, and how a jazz musician and painter came to them by way of borrowed computers.
Before the cube
Mohr was born in 1938 in Pforzheim, Germany. He started as a jazz musician, on tenor saxophone and oboe, and as a painter of gestural abstraction. In 1962 he began to work only in black and white; the information aesthetics of the philosopher Max Bense changed his thinking, and his painting moved towards geometry and rules. Encouraged by the composer Pierre Barbaud, who made music with computers, he wrote his first computer drawings in 1969.1, 2
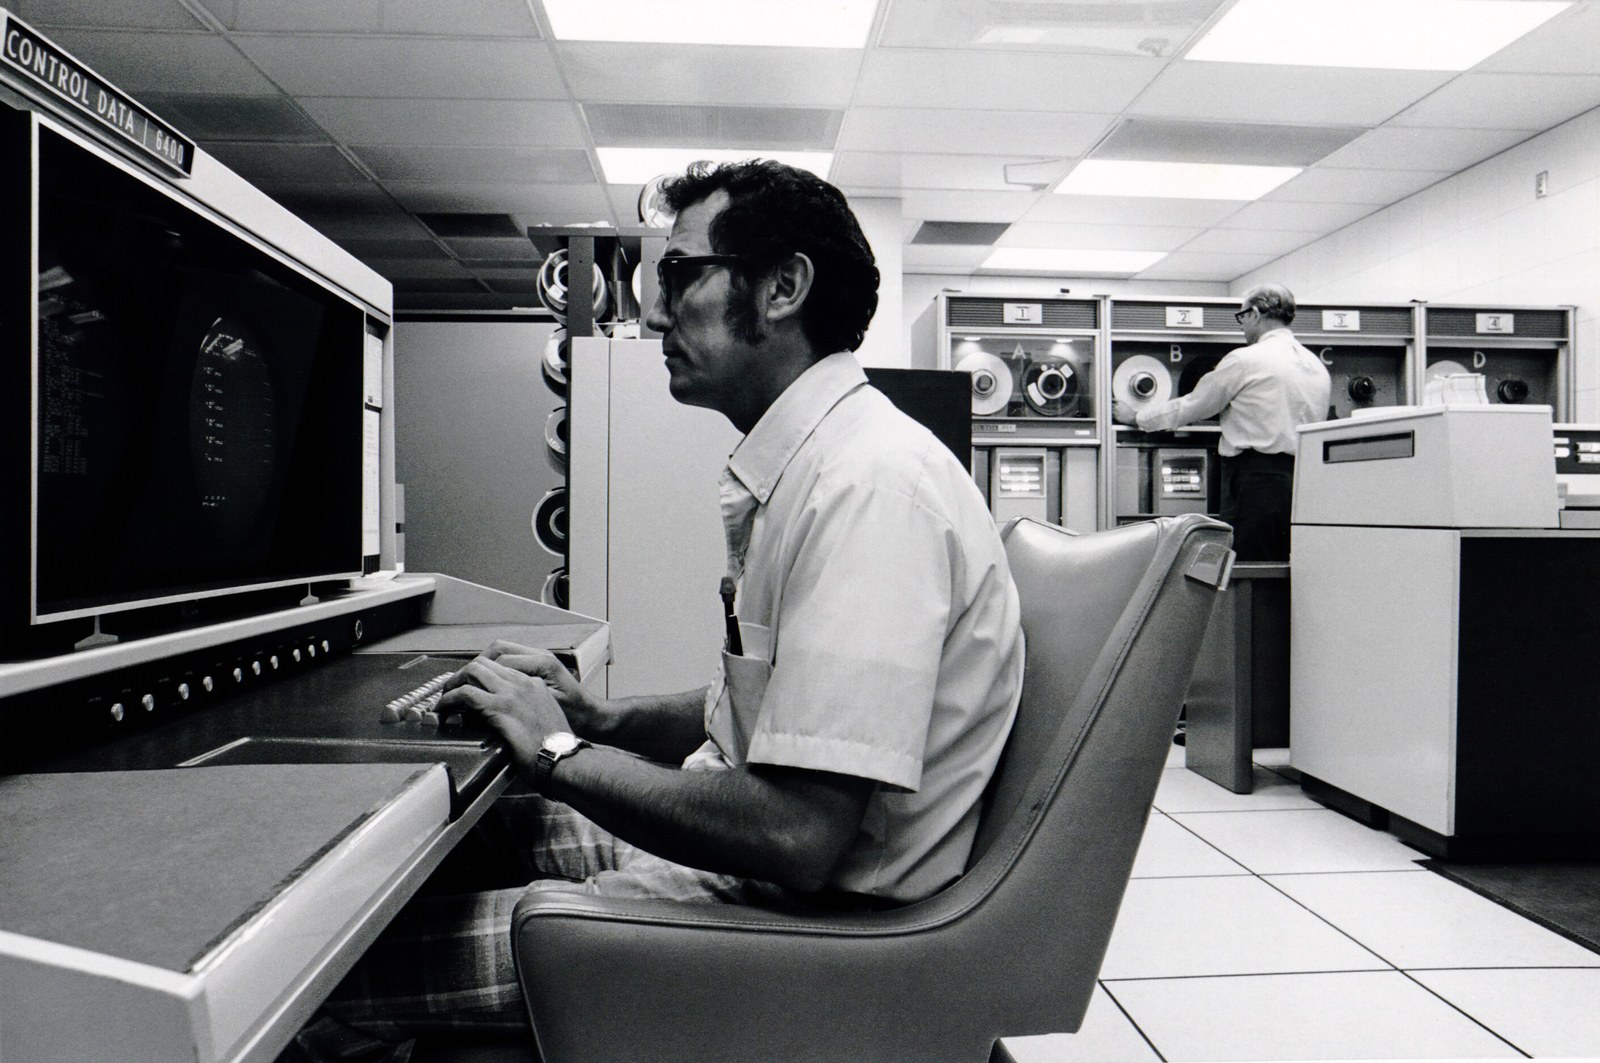
He wrote them at the new University of Paris in Vincennes, which had a computer but nothing to draw with. From the numbers his programs produced, he drew the lines by hand: "Thus my hand was the plotter."1 Then came other people's machines: a friend at Brookhaven National Laboratory ran one of his programs on a light-beam plotter and sent him thirty drawings, and in 1970 he was allowed onto a plotter in Darmstadt. Having seen the French weather service on television, he asked the Météorologie Nationale in Paris whether he could use its CDC 6400 computer and its large flatbed plotter. From 17 June 1970 he worked there at night and at weekends, until 1983.1
.jpg)
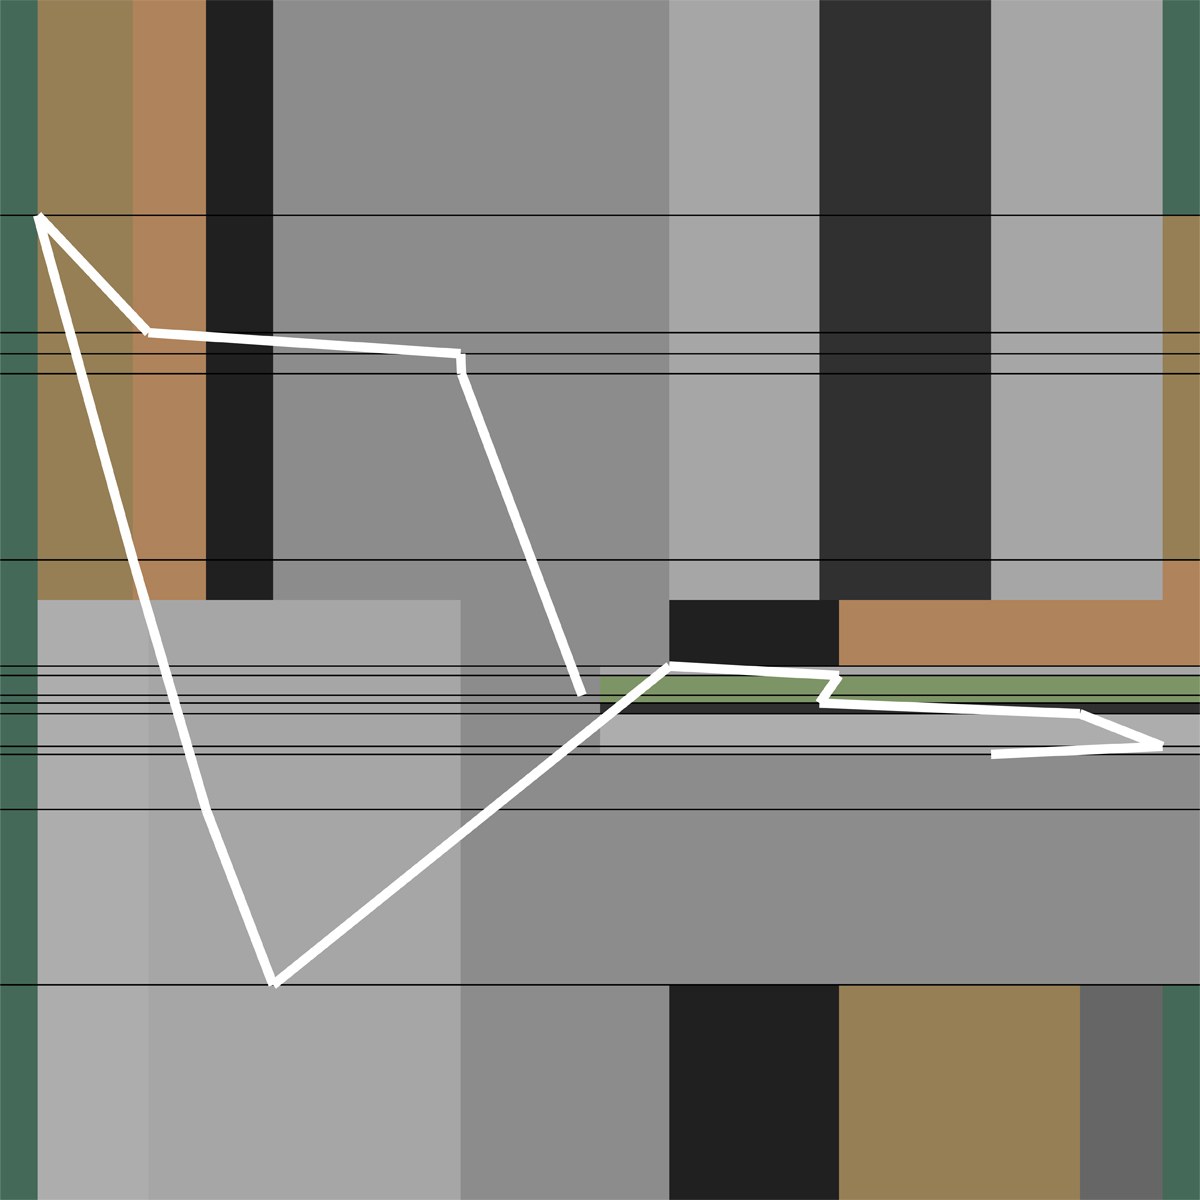
The early programs were random walks and "band structures": lines that step, zigzag and turn into square waves, set in rows from left to right like writing, as in the drawing at the top of this page.1 The Victoria and Albert Museum in London holds early examples, P-18 (random walk) from 1969–70 and P-21 (band structure) from 1970.3, 4 In 1971 the Musée d'Art Moderne de la Ville de Paris gave him a solo exhibition, Computer Graphics – Une Esthétique Programmée, with a plotter installed among the drawings.5
The search for a fixed structure began before the cube. In 1972 Mohr used the lines of squares and triangles as alphabets; in 1973 he moved to the cube.1, 6
Twelve lines
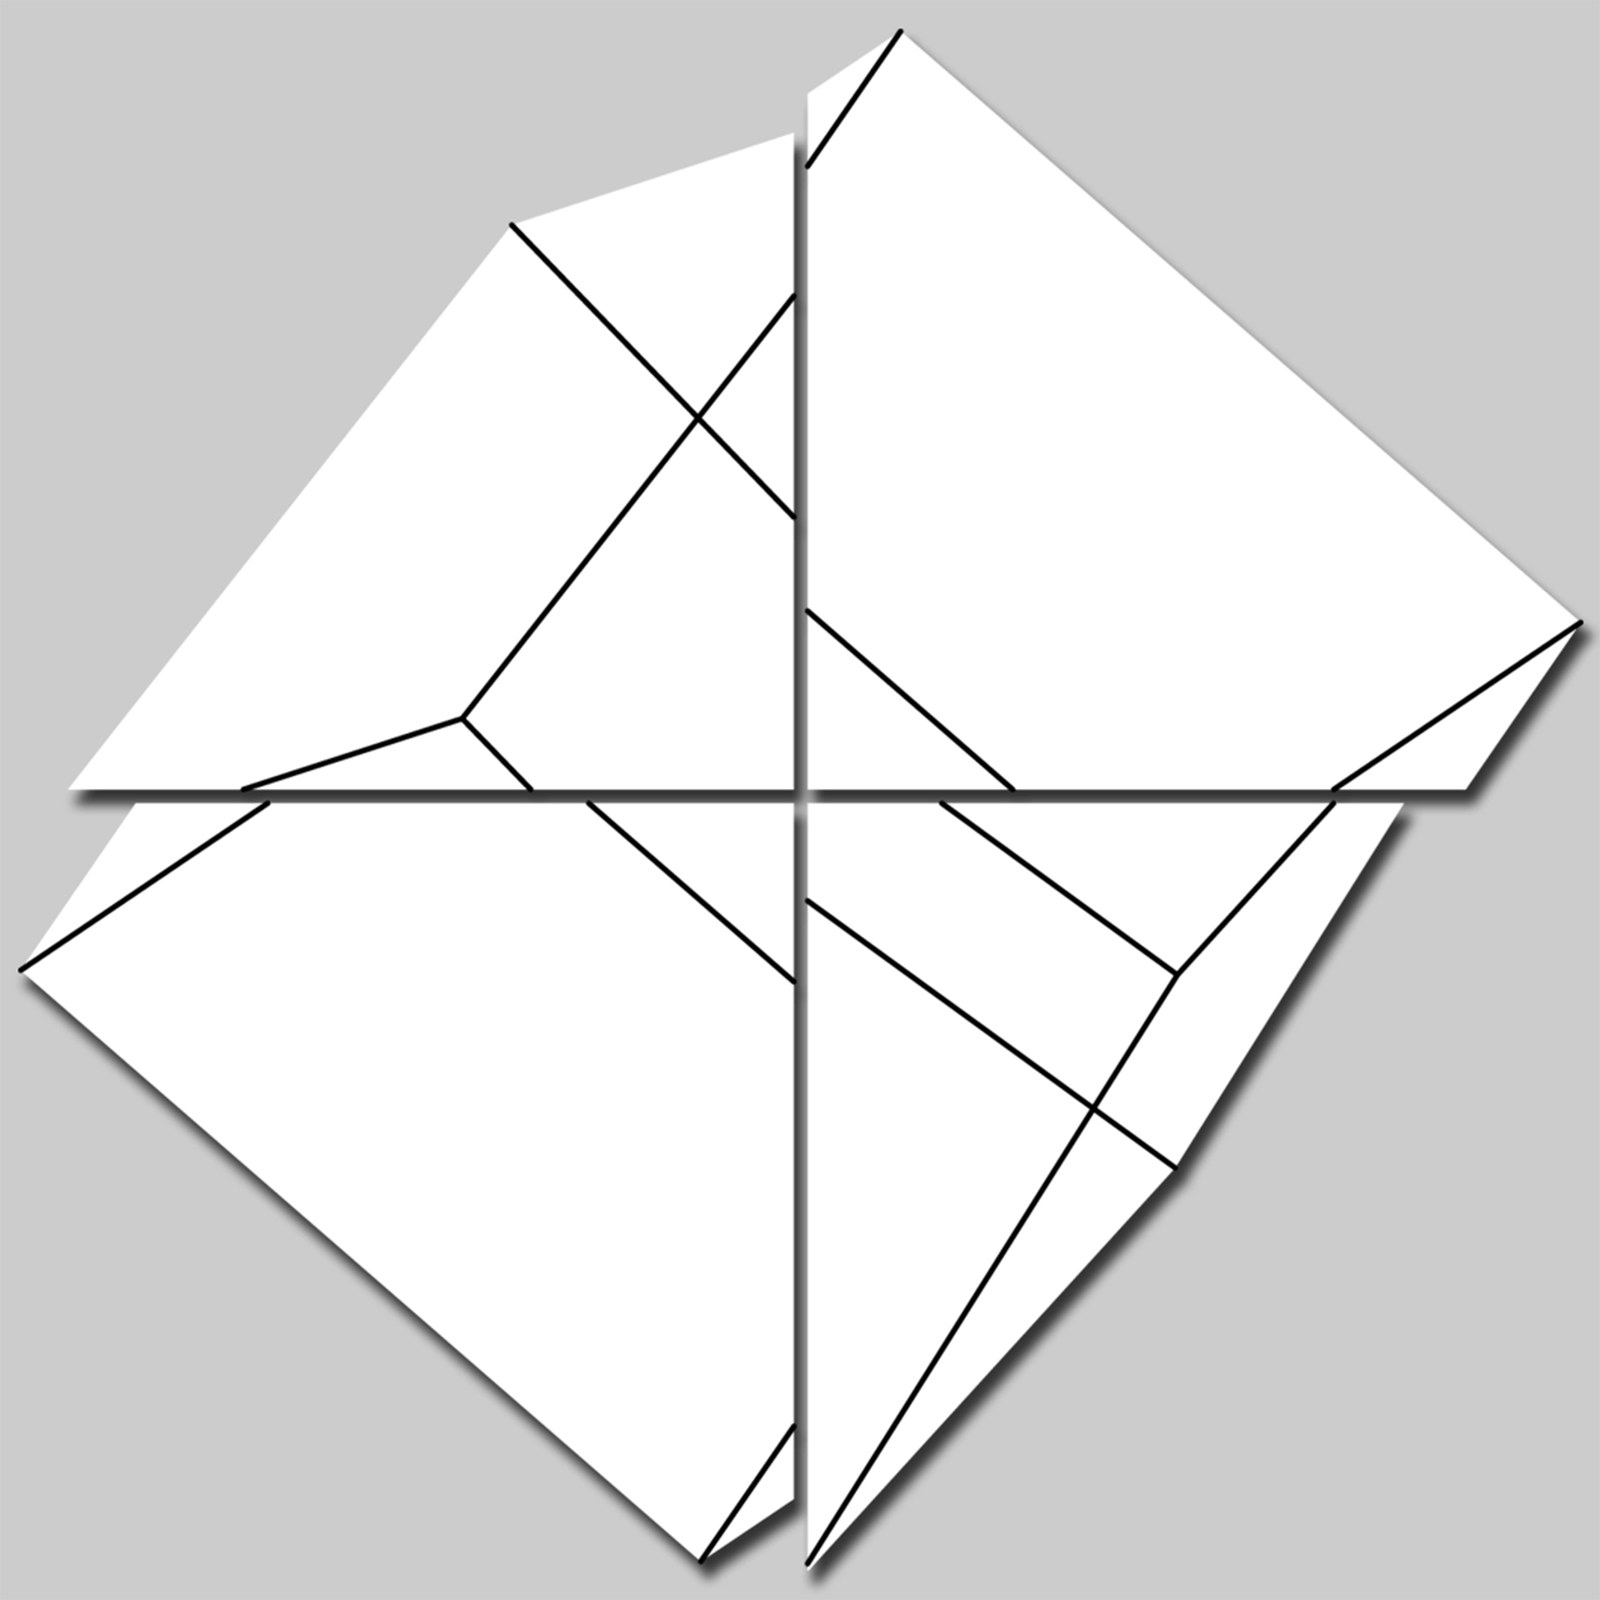
A cube has eight corners and twelve edges. Drawn on paper it is a projection, and once it is rotated, the same twelve lines take on endlessly different angles. Mohr's method is to choose. He compares it to language and music: no one uses all 26 letters at once, or plays all twelve notes of an octave together; one chooses a few and makes a word or a melody. In the same way his programs pick subsets of the cube's edges and leave the rest out. "I was never interested in showing the complete system but only aspects of it, thus visually fracturing the symmetry and at the same time creating an ambiguity in the sign."1
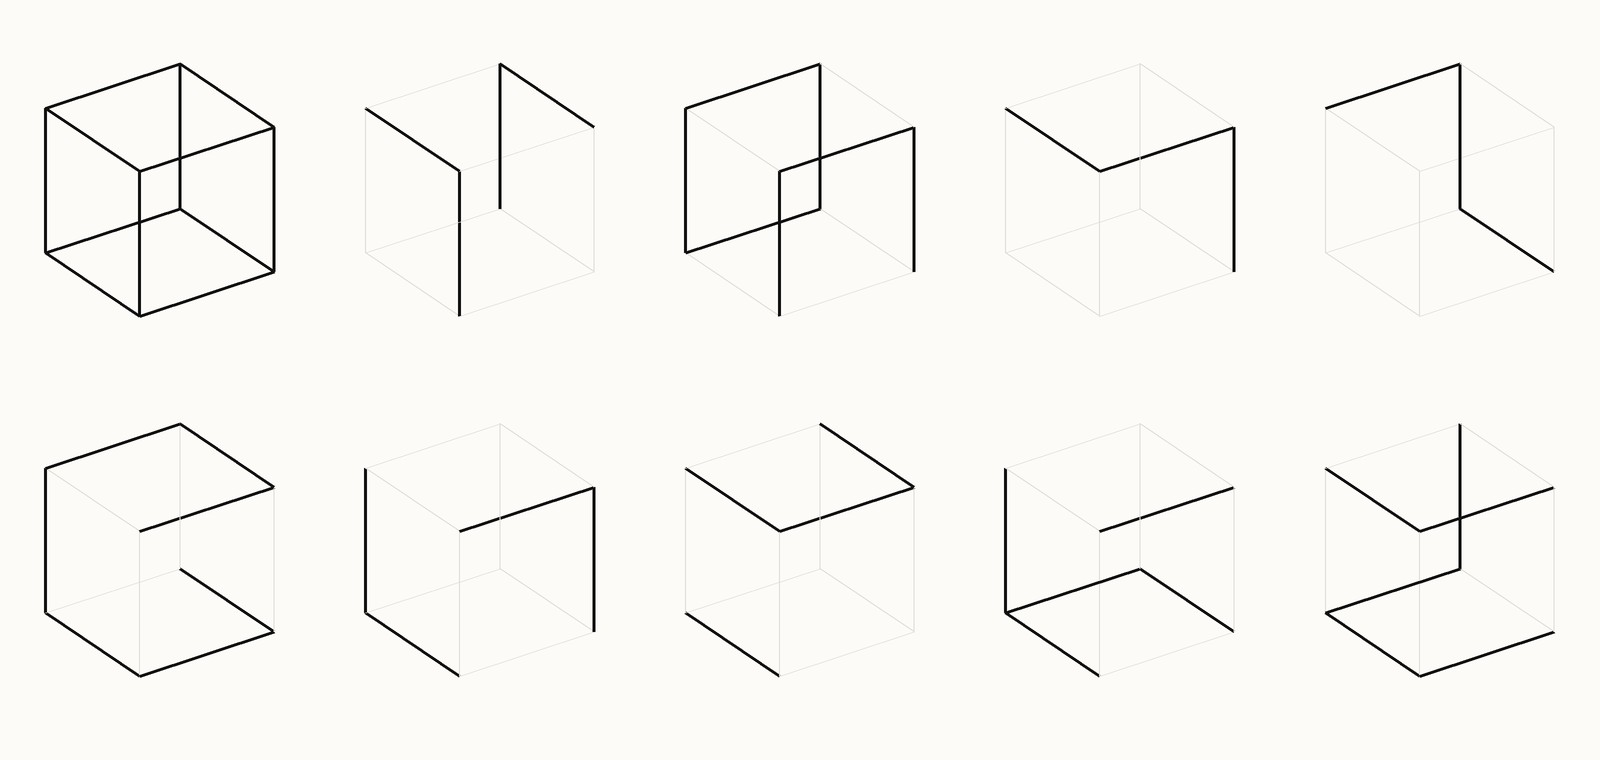
In the series Cubic Limit (1973–75) the cube rotates, and the programs decide which lines appear. Mohr lists the operations he used: series of all combinations of a given number of lines, operations from symbolic logic, clusterings, complementary elements, and diagrams that explain the process with numbers as well as lines.6 He also made two short computer-generated 16mm films, Cubic Limit and Complementary Cubes. The series was first shown at Galerie Weiller in Paris in 1975.1, 6
In Cubic Limit II (1975–77) he began to cut the cube. A square window, the front face of the unrotated cube, divides the lines into inside and outside; planes slice the cube into halves that rotate independently of each other, so that the tension shows along the cut. Lines are also summed into thicker lines.7 The geometry is simple. What it does to the eye is not: a familiar object breaks into signs that are hard to read as a cube at all.
Two cubes, 1974
At the same time in New York, Sol LeWitt made Variations of Incomplete Open Cubes (1974), which proposes all 122 variations in which a cube can be incomplete. Each variation is named by its place in the series; a steel version called Incomplete Open Cube 9/5 is the fifth variation of a cube with nine edges.8
It is tempting to say that LeWitt showed the whole system and Mohr only parts of it, but that is not quite true. Mohr also worked through complete sets: by his own account he showed all combinations of a given number of the cube's lines in a series of thirteen drawings in 1975, and in his films.1 Both artists, in other words, used exhaustive series. The difference lies elsewhere. LeWitt's cubes stand still and can be built: Incomplete Open Cube 9/5 is painted steel, an object in space with edges you can walk around.8 Mohr's cube turns, is projected, cut and clipped; it appears as lines on a flat surface, and his interest, by his own account, is less in completing the set than in the sign each selection makes. LeWitt asks how many ways a cube can be incomplete. Mohr asks what the parts of a cube look like when they are no longer held together by it.
The hypercube
In 1977 Mohr went from three dimensions to four. A four-dimensional hypercube has 16 corners and 32 edges, and can only be seen as a projection. Mohr treats it as a graph, a network of points and lines, and uses it as his "generator of signs". Two methods are characteristic. In one he divides the 32 edges into four random groups of eight. In the other, from 1978, he draws "diagonal paths": routes along the edges between two opposite corners. A hypercube has eight such pairs of corners, and 24 paths between each pair.1
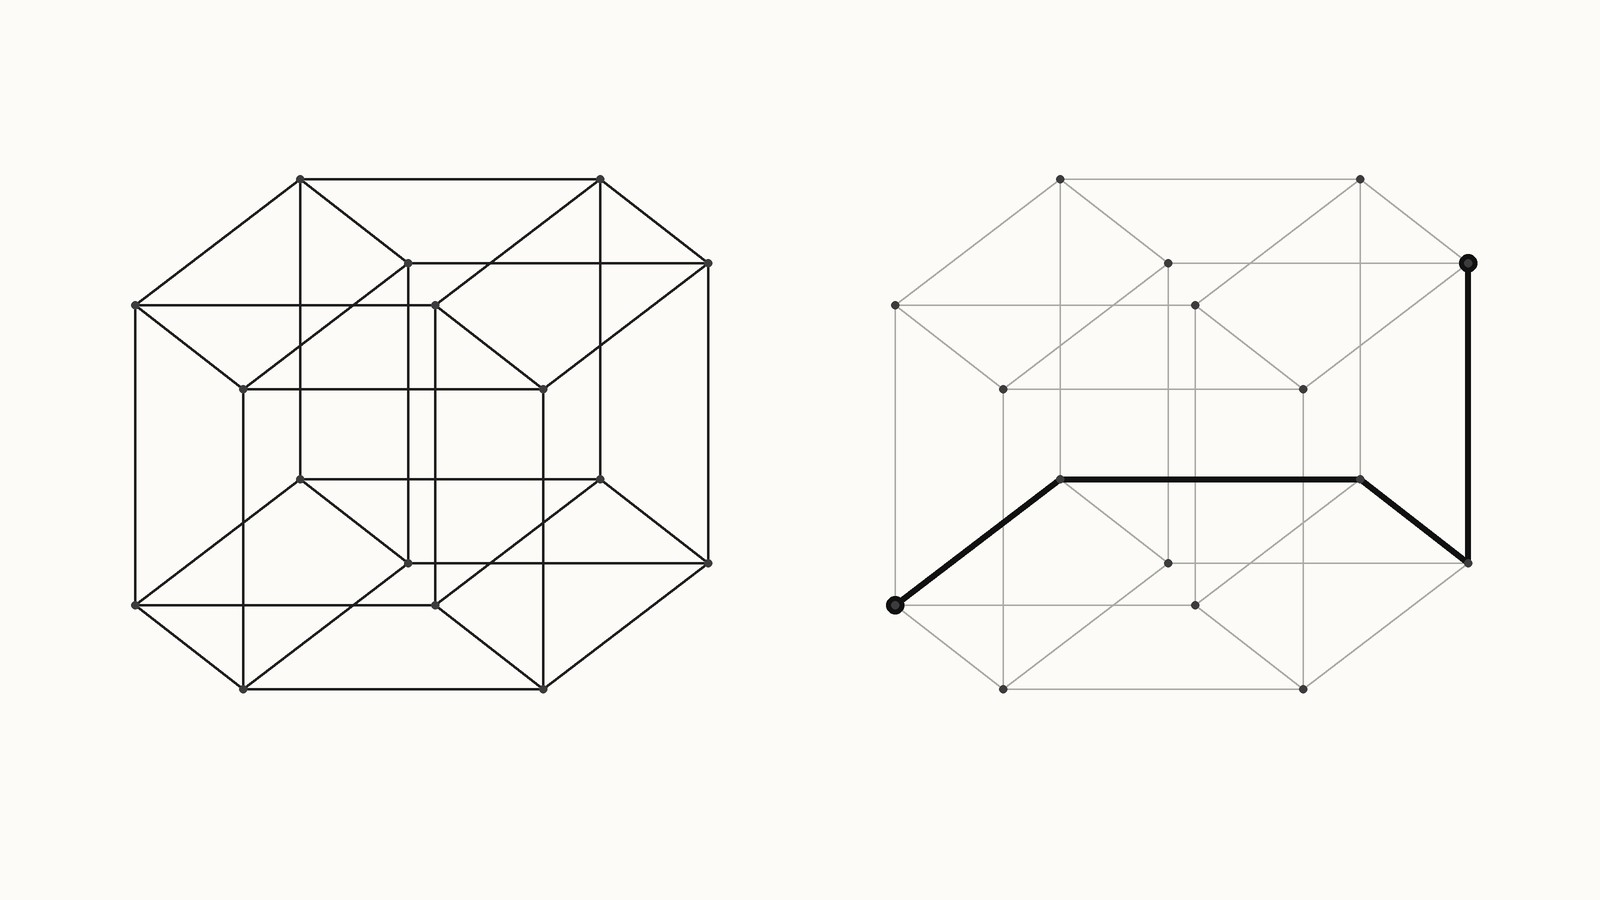
From 1987 he rotated the hypercube in four-dimensional space and projected the result onto the plane, so that the same lines change shape as the object turns through a dimension we cannot see.1 The structure stayed constant while the medium changed: plotter drawings, paintings, shaped canvases, and later works shown on screens with their own computers. P-306-O (1980–82) is an algorithm rendered in acrylic on four canvases.

In 1990 Mohr received the Golden Nica for computer graphics at the Prix Ars Electronica in Linz, for P-411-A; the jury noted that he does all the programming himself.9 In 2013 ACM SIGGRAPH gave him its Distinguished Artist Award for Lifetime Achievement in Digital Art.2
An instrument
Mohr explains the cube with an image from music. One recognises an instrument by its sound; he wanted a visual instrument, and found it in the cube and the hypercube. Every algorithm since then has used them as fixed structures, with fixed relationships between corners, edges and planes, and each work finds new relationships within them.1
That is how one object could last more than forty years. The cube is not his subject. It is the instrument, and the works are what is played on it: in black lines in 1973, cut and rotated in 1977, in four dimensions from 1987, in colour on canvas and screen in the 2010s.

Further reading
- Manfred Mohr's own site, with a detailed timeline and pages on the 1971 exhibition, Cubic Limit and Cubic Limit II.
- The Victoria and Albert Museum, London: P-18 (random walk) and P-21 (band structure).
- Computers and Automation, August 1970, with Mohr's Stairways in the same contest as the Swedish engineer Göran Sundqvist: scan of the issue.
- JAEV Editorial: Sol LeWitt, Computer Art in Sweden, Generative Art.
Sources
- Manfred Mohr, “Manfred Mohr – 50 Year Celebration: Timeline”. emohr.com
The artist's own account. - “SIGGRAPH 2013 Distinguished Artist Award: Mohr”. ACM SIGGRAPH History Archives
- Manfred Mohr, P-18 (random walk), 1969/1970. Plotter drawing on paper. Victoria and Albert Museum, London, E.115-2008
- Manfred Mohr, P-21 (band structure), 1970. Photogravure on paper. Victoria and Albert Museum, London, E.105-2008
- Manfred Mohr, “Computer Graphics – Une Esthétique Programmée, 1971”. emohr.com
The artist's own page on the exhibition, with the catalogue, press and archive material. - Manfred Mohr, “Cubic Limit, Generative Drawings, Part 1. Travaux de 1973–1975”, Galerie Weiller, Paris, 1975. emohr.com
The artist's own page on the series and exhibition, with the catalogue and press. - Manfred Mohr, “Cubic Limit II”, 1975–1977. emohr.com
The artist's own page on the series, with the catalogue. - “Sol LeWitt: Cubic Forms”. Paula Cooper Gallery, New York
- Prix Ars Electronica 1990, Computer Graphics, Golden Nica: Manfred Mohr, P-411-A. Jury statement. Ars Electronica archive