Air-quality measurements as material
JAEV Notes · October 2026 · 2 min read
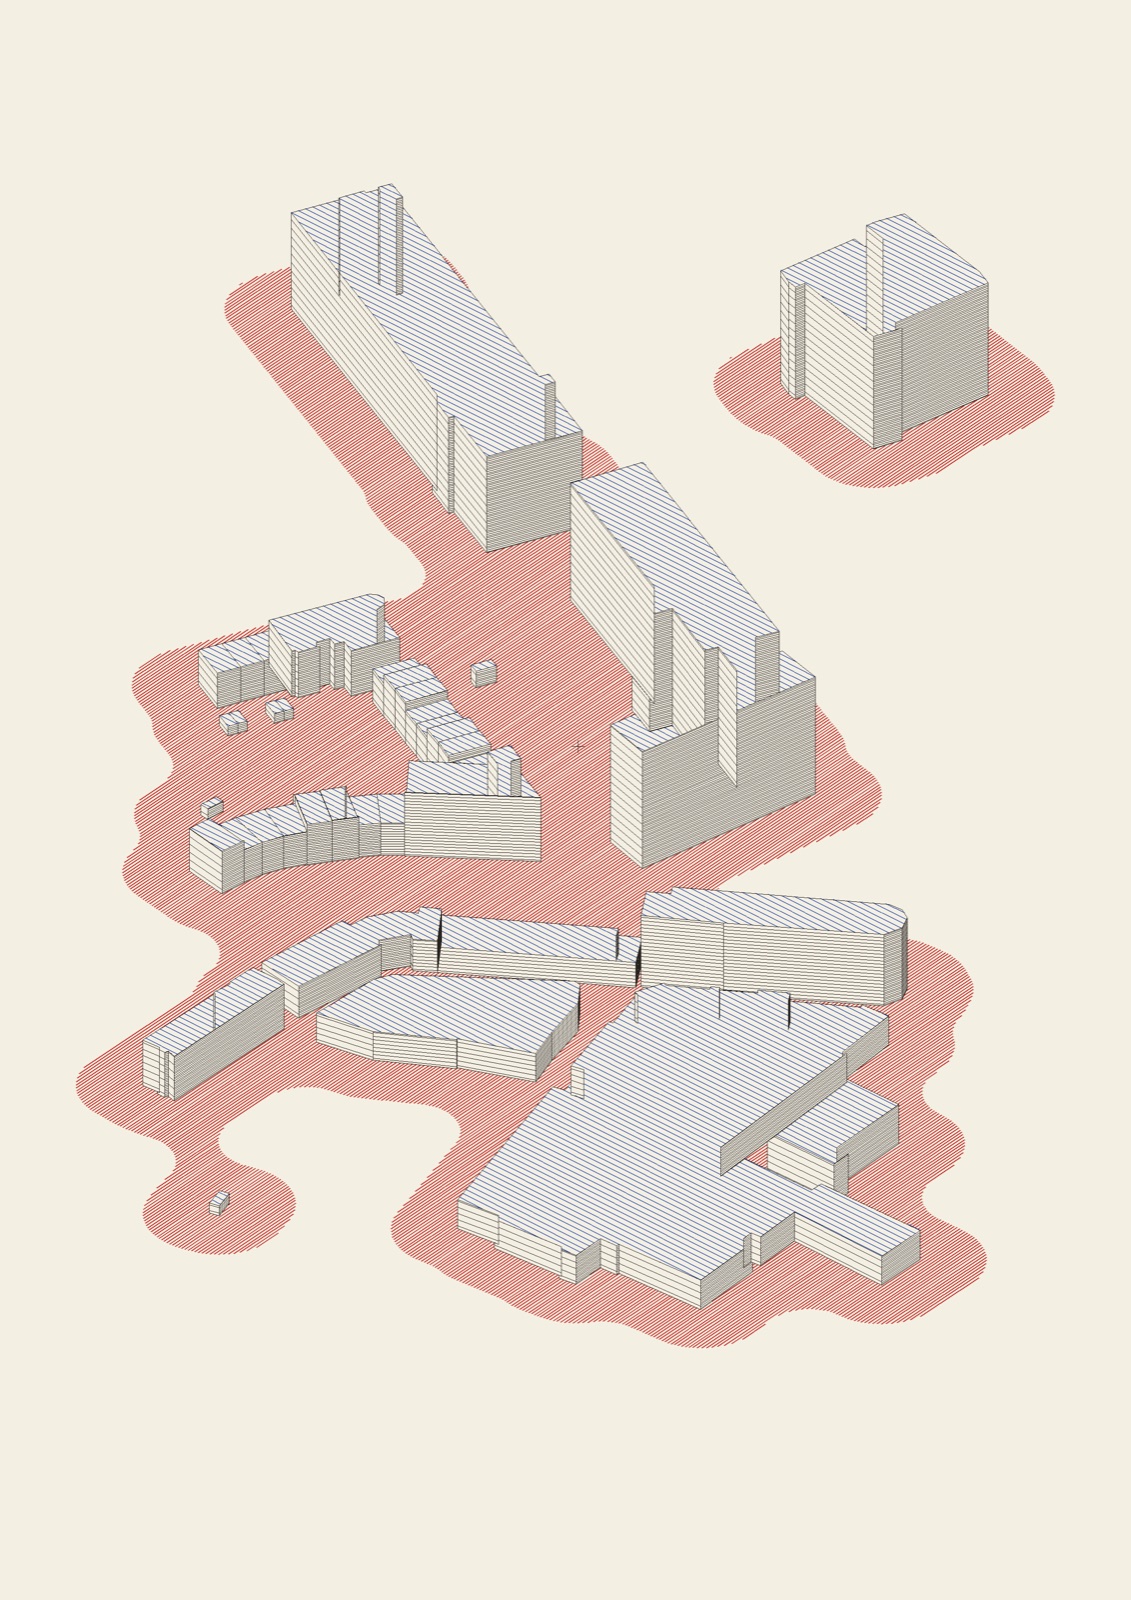
Across Europe, measuring stations sample the air every hour and report what they find to the European Environment Agency (EEA), which publishes the newest readings within a few hours.1, 2 For an artist these numbers are a material like any other: they arrive every day, they belong to a real place, and they describe something nobody can see.
What is measured
Each reading is a concentration at one station, usually given in micrograms per cubic metre (µg/m³) and averaged over an hour.3 Two gases matter most for the works discussed here.
Nitrogen dioxide (NO₂) comes from burning. According to the EEA, transport is the main source and emits half of Europe's nitrogen oxides; road traffic releases them close to the ground in densely populated areas.4
Ozone (O₃) at ground level is not released directly by any source. It forms when heat and sunlight drive reactions between nitrogen oxides and volatile organic compounds.5, 6, 2
Limits and how often they are passed
Under the EU directives, the hourly NO₂ concentration should not exceed 200 µg/m³ more than 18 times a year, and the annual mean should not exceed 40 µg/m³. The WHO's 2021 guidelines are stricter for the long term: an annual mean of 10 µg/m³ and a daily value of 25 µg/m³ on no more than three or four days a year.3
The gap shows in the EEA's figures for 2025: 0.5 % of stations were above the EU annual limit for NO₂, 87 % of them traffic stations, while 66.9 % were above the WHO annual guideline.4 For ozone, 22.4 % of stations were above the EU target value.5
Unverified data
The newest readings come out two to five hours after measurement and cover the last ten days. The countries have not validated or verified them, the EEA states, and they should not be used to check compliance with air-quality standards.1 That is a limitation for a report. The same limitation, for a drawing, can be the subject: the reading as it stood on the day.
Two more things follow from the data. A station measures the air where it stands, not a street or a city. The hours also do not line up: nitrogen dioxide peaks near busy streets in the morning and evening rush, while ozone rises in the afternoon, so a day's highest hour of each comes from different times.2
Where to see it
Olof Broström's Unverified Air makes one drawing a day for a year, from 4 October 2026 to 3 October 2027. Each day the program draws a country at random, then a station there that measures both gases, and lays the previous day's highest hour of each over the buildings around it: nitrogen dioxide as red lines on the open ground, ozone as blue lines over the roofs, closer together as the values rise. The air-quality figures are the EEA's unverified up-to-date data, published under CC BY 4.0.2
Sources
- Up-to-date air quality data viewer. European Environment Agency
“The maps show up-to-date (UTD) air quality data for the last ten days.” “In general these data are available in this viewer 2 to 5 hours after measurement.” “These data are not officially validated and/or verified by the countries” and “should not be considered for compliance checking against air quality standards.” - “Unverified Air”, Olof Broström. JAEV, Lund
One drawing a day, 4 October 2026 – 3 October 2027; a random country, then a station there measuring both gases; the previous day’s highest hour of each; NO₂ as red lines on the ground, O₃ as blue lines on the roofs; data: EEA, unverified up-to-date data, CC BY 4.0. - “CAMS ground-level NO2 forecast”. European Climate and Health Observatory, European Environment Agency
EU: “hourly NO2 concentrations should not exceed 200 µg/m3 more than 18 times per calendar year, and mean annual concentrations should not exceed 40 µg/m3.” WHO 2021: annual 10 µg/m³, daily 25 µg/m³ “more than 3-4 days per year”, hourly 200 µg/m³. - “Nitrogen dioxide (NO₂)”, in Air quality status in Europe 2026. European Environment Agency, 30 April 2026
“The main source of NO2 is transport …, which emits half of the annual NOX emissions in Europe.” In 2025, “0.5% of monitoring stations registered concentrations of NO2 above the current ALV; 87% of these were traffic stations”; “66.9% of monitoring stations registered concentrations above the WHO annual AQG level”. - “Ozone (O₃)”, in Air quality status in Europe 2026. European Environment Agency, 30 April 2026
Ozone forms when “heat and light cause chemical reactions between nitrogen oxides (NOX)” and volatile organic compounds. “In 2025, 22.4% of the reporting stations registered concentrations above the TV threshold.” - “Ambient (outdoor) air pollution”, fact sheet. World Health Organization
Ozone “is formed through the reaction with gases in the presence of sunlight”, “one of the major constituents of photochemical smog”. “NO2 is a gas that is commonly released from the combustion of fuels in the transportation and industrial sectors.”
- Published
- JAEV Notes, October 2026.
- Use
- Text CC BY 4.0. Free to use and quote with credit to JAEV and a link to this page. Images and quotations by others keep their own terms.
All texts as one file: archive.json - Cite
- JAEV Notes, “Air-quality measurements as material”, jaev.gallery/notes/air-quality-data-as-art-material/, 2026.
- Corrections
- Additions and corrections are welcome: info@jaev.gallery
- Share
A link from your own site, course page or reading list helps others find it.- Follow
- New notes by RSS · Instagram · Bluesky
JAEV is a daemon taking shape: machines, weights, room, brain.