COLOR, Mikael Jern's raster program (Lund, 1970s)
JAEV Notes · October 2026 · 3 min read
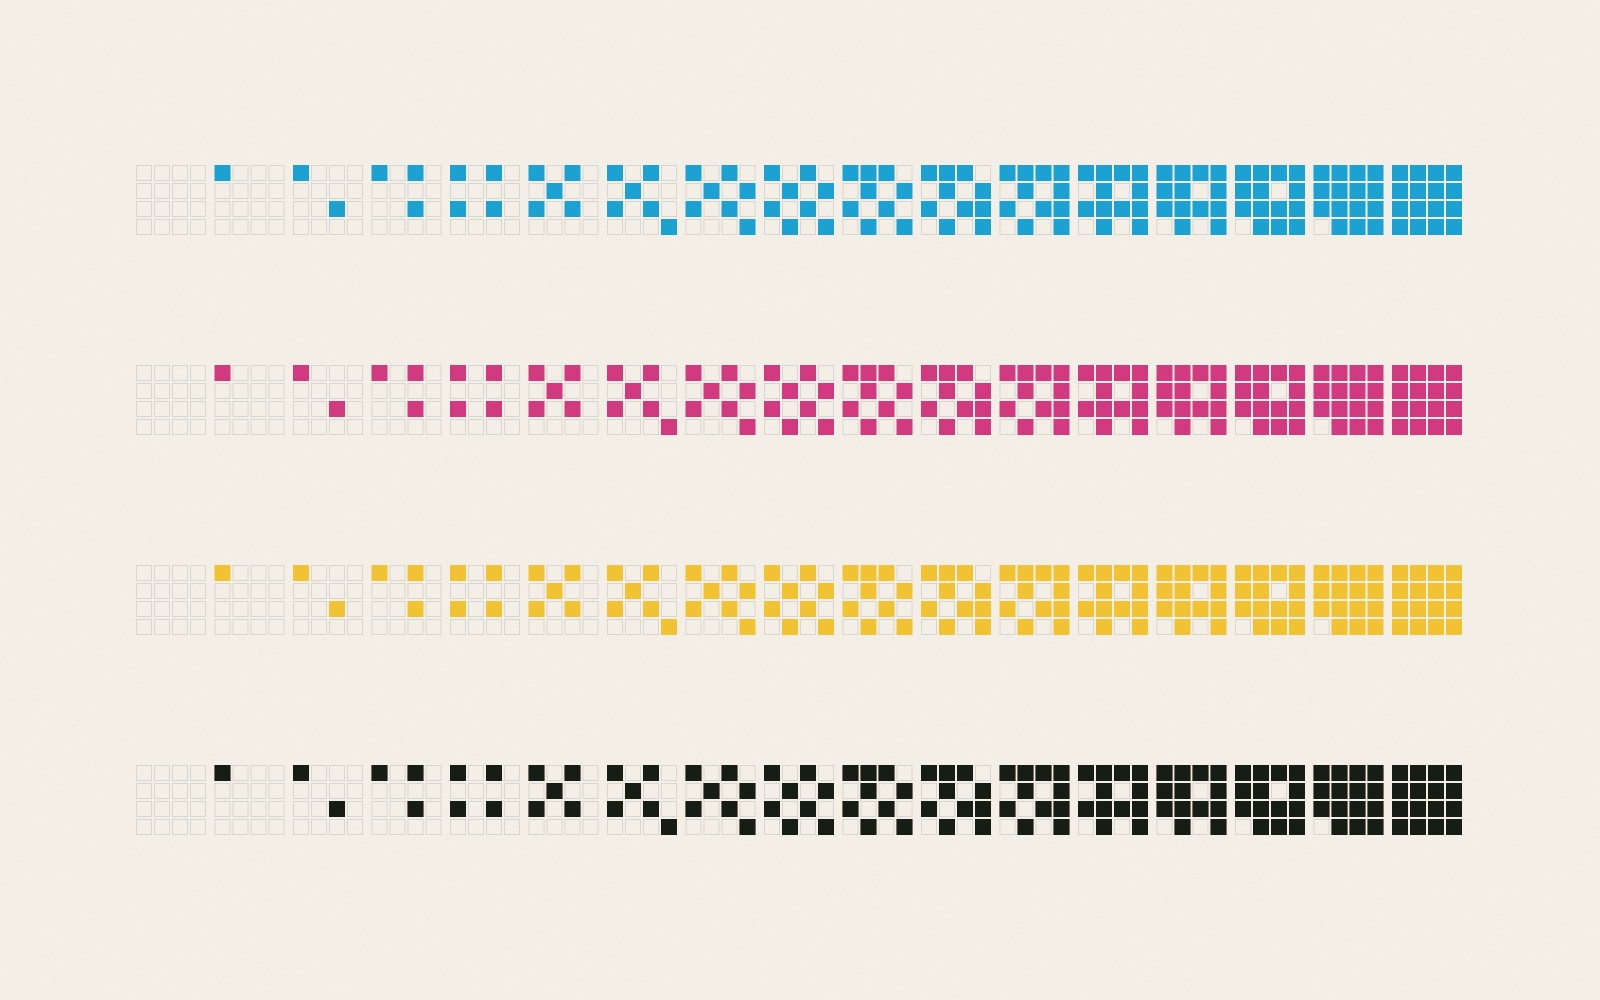
COLOR was the software that Mikael Jern wrote at Lund University's computing centre in the 1970s to drive Hellmuth Hertz's ink-jet colour plotter. It turned data into a grid of coloured dots, ran on a UNIVAC 1108, was sold with the plotter to the American company Applicon, and became the starting point of Jern's company UNIRAS.1, 2
Before the plotter
Jern, a mathematics student, started as a night operator at the computing centre in 1968. Before there was a colour plotter he made maps on the line printer for town planning research: by printing the letters a, b and c on top of each other in the same place he got darker and lighter greys, with the program SIMAT.3
How it works
Tones from dots. The plotter could only print a dot of ink or leave it out. To get lighter and darker tones, Jern grouped the dots in squares of four by four. The more of the sixteen dots are printed, the stronger the colour.3 With none to sixteen dots, each ink has seventeen levels, which matches the cube it drew: 17 × 17 × 17 small cubes.4
Part of the picture at a time. An A4 image was millions of dots; the computer had 64–128 KB of memory. Jern wrote a paging system that kept only the active part of the image in memory and wrote the result to magnetic tape, line by line, for the plotter.3
Hidden surfaces. In three-dimensional pictures, surfaces behind other surfaces must not show. With line drawings this was one of the hardest problems in computer graphics. On a raster it can be solved by drawing the far objects first and letting the near ones paint over them, the "painter's algorithm". Jern cut holes and slices out of the colour cube to show that raster graphics could do what line graphics could not.3
A toolbox, not an application. COLOR was a set of FORTRAN subroutines. Users wrote short FORTRAN programs of their own that called them to draw, for example, a contour map or a 3D map.3 It was installed on computers in the United States, Canada and Australia; users posted tapes to Lund and got prints back by post, so one round could take weeks.3 In spring 1977 SIGGRAPH's journal Computer Graphics printed a paper by Jern titled "Color Jet Plotter".5
What it was used for
Mostly data: population maps with Statistics Sweden, contour maps, seismic images for oil companies, and in 1973 maps of metals in the river Vegeå.3 Jern dates his colour cube to 1972; Cooper Hewitt dates it to 1979.3, 2 The artists Beck & Jung later used the program, run for them by the programmer Bob Wissler, and Cooper Hewitt holds their The Chromo Cube (1980), credited "after software developed by Mikael Jern".3, 2 Who made the cubes is discussed in The colour cubes, and Olof Broström's Automatic Colour Cubes at JAEV brings such cubes together with Sol LeWitt's Incomplete Open Cubes.
Applicon and UNIRAS
The plotter and COLOR went to Applicon. Jern's account has the contracts signed in 1976, with the software sold for about 60,000 dollars.3 Jern moved to Boston in 1979. When raster screens appeared, Applicon did not want the software adapted to them, and Jern left; with the Danish geophysicist Jan G. Knudsen he founded UNIRAS (Universal Raster System) in 1980.1, 3 UNIRAS used the colour cube as its logo.3
Sources
- Thomas Larsson and Ulf Stenlund, “Vignettes of Sweden's Computer Graphics History”. IEEE Annals of the History of Computing, 2008
“In collaboration with Hertz, Mikael Jern developed COLOR, rasterization software that was unique during the 1970s.” Sold to Applicon in 1977; UNIRAS (Universal Raster System) with Jan G. Knudsen, founded 1980; acquired by AVS in 1993. - Lisa Adang, “The Aesthetics of the Color Plotter”. Cooper Hewitt, Smithsonian Design Museum, 8 May 2018 (first published 29 October 2016)
“The program could create smooth color transitions by incrementally adjusting the dot density in a series of 16 steps.” “Color also allowed for up to 25 different dot patterns.” Jern: “a very flexible program system [that] enables programmers with little experience to generate color pictures”. Cube dated 1979; Beck & Jung, The Chromo Cube, 1980, 1981-19-1. - Mikael Jern, interviewed by Anna Orrghen, 4 October 2007. Från matematikmaskin till IT, Tekniska museet, Stockholm
In Swedish. Operator at the computing centre from 1968; overprinted letters on the line printer; SIMAT; 4 × 4 dot matrix; painter's algorithm; FORTRAN subroutines; installed on IBM, UNIVAC and CDC machines abroad; cube “gjordes redan 1972”; software sold for $60,000; Boston from 1979; left the computing centre in 1982; company bought in 1992. - Anna Orrghen, Från matematikmaskin till IT. Fokusgrupp: Media. Slutrapport. Tekniska museet, Stockholm, 2008
“Programmet kunde rita upp en färgkub som bestod av 17x17x17 mindre kuber.” - “Computer Graphics: A Quarterly Report of SIGGRAPH-ACM”, Spring 1977, vol. 11, no. 1. ACM SIGGRAPH History Archives
Table of contents: “Color Jet Plotter, Jern”. Contents of the article not read by JAEV.
- Published
- JAEV Notes, October 2026.
- Use
- Text CC BY 4.0. Free to use and quote with credit to JAEV and a link to this page. Images and quotations by others keep their own terms.
All texts as one file: archive.json - Cite
- JAEV Notes, “COLOR, Mikael Jern's raster program (Lund, 1970s)”, jaev.gallery/notes/color-program-mikael-jern/, 2026.
- Corrections
- Additions and corrections are welcome: info@jaev.gallery
- Share
A link from your own site, course page or reading list helps others find it.- Follow
- New notes by RSS · Instagram · Bluesky
JAEV is a daemon taking shape: machines, weights, room, brain.